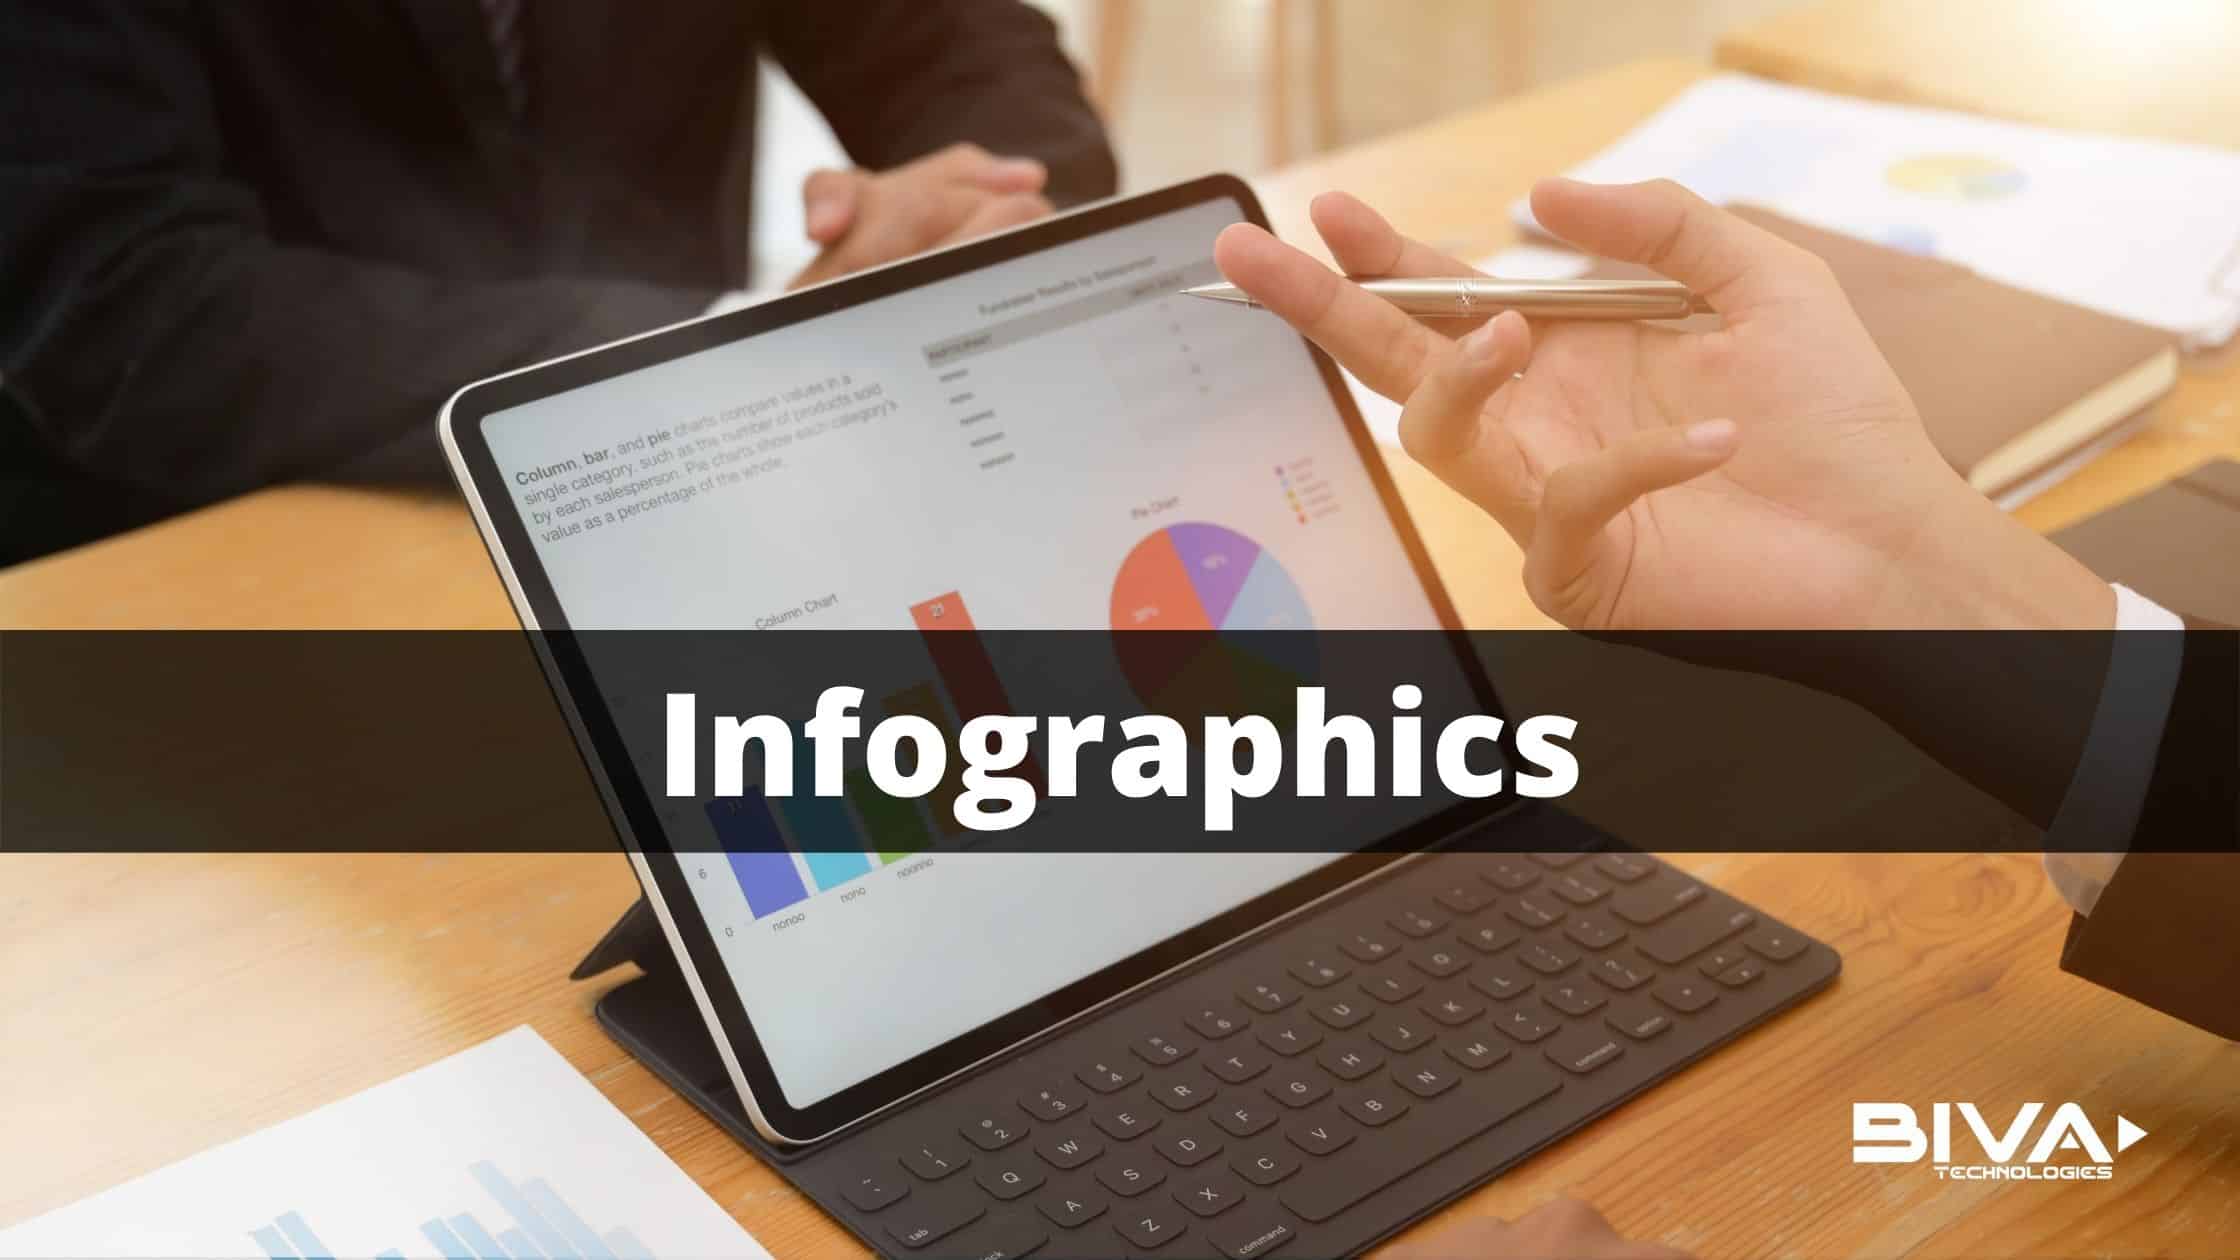
Infographics is one of the most important engaging content marketing equipment that easily brings conversion. Today infographic has no alternative. As a result, almost every small, medium and large business targets infographics to get the attention of their prospects.
Infographic is a combination of graphic and information. It is one of the best business engagement tools in this era.
Infographics is a leverage growth hacking tool that indulges business needs and growth at a time.
As a digital marketing professional, I have seen huge transformation from banner ads to infographics.
Almost every business targets it first due to its productivity.
We know that every business has some specific goals. One of them is to bring conversion.
Infographics is one of the best tools that easily brings conversion.
Why?
Because, it simply summarizes the complex matters easy and sophisticated.
I hope you can understand what I’m gonna discuss now.
Here in this article I am going to discuss how to create and curate an infographic even if you have no knowledge of designing.
Almost every business owner wants to create unforgettable infographics. For that they need to hire some techy persons.
However, sometimes it does not support their funds. As a result, their wish of creating and curating infographics is not fulfilled.
See, graphic design knowledge is definitely a bonus. But actually, an infographic is not only based on graphic design knowledge, It depends more on the content you are going to publish there.
Here I’ll disclose how to create infographics for free.
Before staring, let me clear one confusion. Infographics are not the same as templates. Rather these are more than those.
Let’s dive at the steps to create unforgettable infographics.
Before that, you definitely know what an infographic is!
What is an Infographic?
I don’t repeat any orthodox definition. Rather I always prefer to focus more on the need.
According to me, the infographic is a visual communication tool based on
“images, texts, charts, or statistics”.
Midori Nediger
According to wikipedia, the infographic “pursuits information visualization, data visualization, statistical graphics, information architecture.”
 1 -")
Let’s summarize it.
An infographic is nothing but a visual template that comes with
“imagery charts and minimal text” to provide an “easy to understand overview” of a particular topic or subject.
Midori Nediger
You may ask what type of topic you can cover via infographics.
Everything, whatever the topic you’d like to cover!
In a word, every infographics help to increase productivity with engaging visuals for caster and quicker communication tool or element (not software).
Types of Infographics
Infographics are needful indeed. If you know the types of infographics, that can help you a lot.
Here are the most popular types of the above that always help to find your goal.
Listicals or Listographics
Do you know every successful business follows the AIDA funnel? The listicles always cater to options before the audience.
The listicle content focuses like below.
Top 10 FREE Google Tools for digital marketing
Have a look.
- Google Search Console
- Google Analytics
- Google Page Speed Insight
- Google My Business
- Google Ads
- Google Ads Keyword Planner
- Google Trends
- Google Tag Manager
- Google Developer Tool
- Blogspot
Through that infographics, I cater to the free Google tools related to digital marketing.
Process Infographics
Do you know people love to find DIY. Do it yourself or DIY is one of the most famous and leading content types today.
The process infographics help to find the step by step process of an action or activity.
Here is an example for you.
Suppose you wanna send emails. What would be the process!
- Type Gmail.com or search gmail in Google or any search engine.
- Login there with correct credentials.
- Go to the left hand side and choose Compose
- Type the recipient email address (eg. help@bivatechnologies.com)
- Type subject of the email along with the body
- Additionally, attach file if you want to
- Click on the send button.
Remember, I am using Gmails, you can use anyone instead of that!
Comparison Infographics
When people are at a very close step to take any action, they basically go through comparison.
In this type of infographics, customers can easily understand what is beneficial for them.
Let’s see an example.
Suppose here is a comparison with two important WordPress page builders Elementor vs Divi. The comparison must cover what people want to know like:
- Price
- Feature
- How easy or How tough
- Additional features for advance customization.
- More
Timeline Infographics
When you have a plan to conduct a series of events in the form of storytelling, you can use this pattern.
It may be something like the history of your organization, or a schedule or a process, whatever it is, the primary focus is to communicate with the prospect or customer.
Many B2B and B2C business models use these types to get in touch.
Now, what does it cover!
It basically covers:
- Roadmap
- Business history
- Study guide before examination
- Recipe timeline
- Resume timeline
So, you can understand how important the timeline infographic is!
There are other types of infographics available like:
- Statistical
- Anatomical
- Multi-chart
- Location oriented and
- More.
What should be you Plan to Create Infographics
Whatever the type is, the primary focus should be planning. Every successful content marketing strategy needs a true focus.
Infographics design is tremendously important but more important is to concentrate on user intention.
What are Those?
Look at the penta.
- Crafting goals that you want to deliver
- Focus Important Sections
- Choose the perfect layout
- Use compelling color and fonts
- Write engaging content.
Crafting Goals that you Want to Deliver
When you listen to crafting goals for any business, you definitely need to focus
- Target audiences with demographic
- Why are you targeting (convince)
Like every business, the infographics also target the audience.
Suppose you are making an infographic on ‘selling leggings online’.
How would it be!
- Your target audience preference is girls
- Age preference is 16-35
- Price bracket as per demographic
- What is speciality in your product/service (may be discount, design or material)
Always remember, a perfect infographic deals with the user intent.
Focus Important Sections
People love beautiful design. So, you need to focus on the important sections like
- Title and the header section
- Body of the infographic
- Bottom sections or footer
Every perfect template must have these three important sections.
The title and the header section helps readers to understand about the topic.
The body is the content part, covering the detail of the topic.
The Footer or the bottom part is additional information like your business detail.
There may be some additional features, however, the above three are always the primary focus.
Choose the Perfect Layout
Every infographic is not the same, so you need to be careful choosing the perfect template.
Today you can find lots of readymade templates for your needs.
Choose the perfect one that truly triggers your business or purpose. Your design must comply with your purpose.
Use compelling color and fonts
You may think every color is good enough. That’s true only as a general purpose. But if you wanna solve a particular purpose, or trigger the user intent, you need to focus on the appropriate color combination.
Not only the color, you have to be careful choosing fonts.
Why!
The readability matters the most.
So, if your font is clear to understand, you can easily meet your destination. I personally focus simplicity on choosing both color and font.
Write engaging content
Engaging content is the winning formula.
How!
See, you have curated a good infographic, but your infographic does not cover any new things, your creation may go to vain.
So, my personal suggestion is to focus on three things below
- Research topic that solve your goal and meet user intention
- Choose tools like Quora or ‘People also ask’ by Google (Answer the Public also)
- Create content that precipitates your researched part and solve user queries.
Sum Up
So, you can easily understand what to do and how to do it. Infographic is one of the most important and engaging content marketing tools as well. Every small and medium business is focusing on the infographics because of its productivity and importance as well.
Ref: Visme Blog
I am a Digital Marketing Trainer, Digital Marketing Strategist, Career Coach, Affiliate Marketer, Content Writer, SEO Professional, Paid Advertisement Specialist, Social Media Expert, and Entrepreneur. I am the founder of Biva Technologies, Hungry Tourer and more. I assure quality and productive Digital Marketing Training and Services.
Since 2018 I have been providing quality Digital Marketing Training and Services at Biva Technologies. Some of our top-rated services are:
Digital Marketing Training
Full Digital Marketing Services
Content Writing
SEO
PPC (Paid Advertisement)
Content Marketing
Email Marketing
Meta (Facebook) Ads
Video Marketing and More.
Follow and Contact me: LinkedIn, YouTube, Facebook, Instagram, X (Former Twitter), Google Business Profile

Such exceptional information about creating infographics. You explained the entirety of this article well overall. Much obliged for your significant data.
Thank you for your valuable comment. I am happy to hear that I’ve covered this article with significant data.